The Impact of Data Visualization
A distribution company implemented a new dashboard for its sales team with the objective of fostering healthy competition among its Key Account Managers (KAMs). The new strategy focused on the ABC segmentation model and the average invoice value per segment. By measuring selected KPIs, it became clear that the top-performing sellers were those who consistently adhered to the new strategy. The company quickly realized that the best way to convince those loyal to the old model was through transparency—allowing them to see the results for themselves.A Simple Dashboard to Compare KAMs’ Performance
We designed a general dashboard page where anyone could analyze and compare the performance of different sellers. Additionally, it featured individual pages with detailed information about each KPI. Making this information available to the entire team not only benefited the KAMs but also served as inspiration for their colleagues.With Great Power Comes Great Responsibility
Salespeople are often proud, self-confident, and competitive by nature. Embracing this competitive spirit, management recognized the importance of making the competition fair and transparent. Data visualization has a powerful psychological effect by providing a clear goal to strive for. The KPIs you select will set the tone for the company and the nature of the competition. However, as with any powerful tool, it must be used responsibly. Maintaining fairness and keeping the competition healthy is essential, and software can be a valuable ally in achieving this.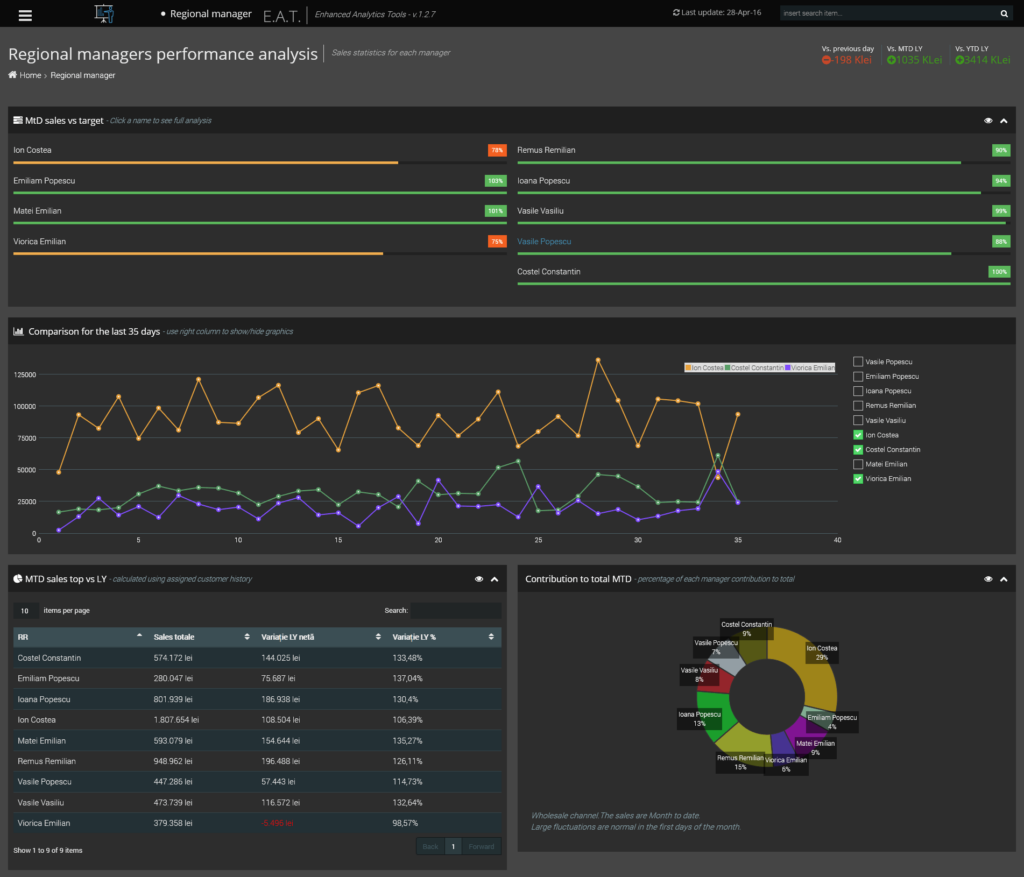
The Challenge: Accurate Measurement
How do you accurately measure the performance of KAMs responsible for different territories? Several options were considered:- Versus target: Since target revenue is the foundation of all sales KPIs, it seems logical to place it front and center. However, a seller who takes over a poorly managed region may appear to be a superstar, while the reality is quite different.
- Total revenue: Overall revenue is a critical KPI, but it’s important not to favor KAMs simply because they work in the most lucrative markets. Factors like industry, region, and market size must also be considered.
- Growth percentage: This allows KAMs from smaller markets to compete with those from larger ones. However, it risks giving one KAM an unfair advantage if they secure a deal that is massive for them but small for others.
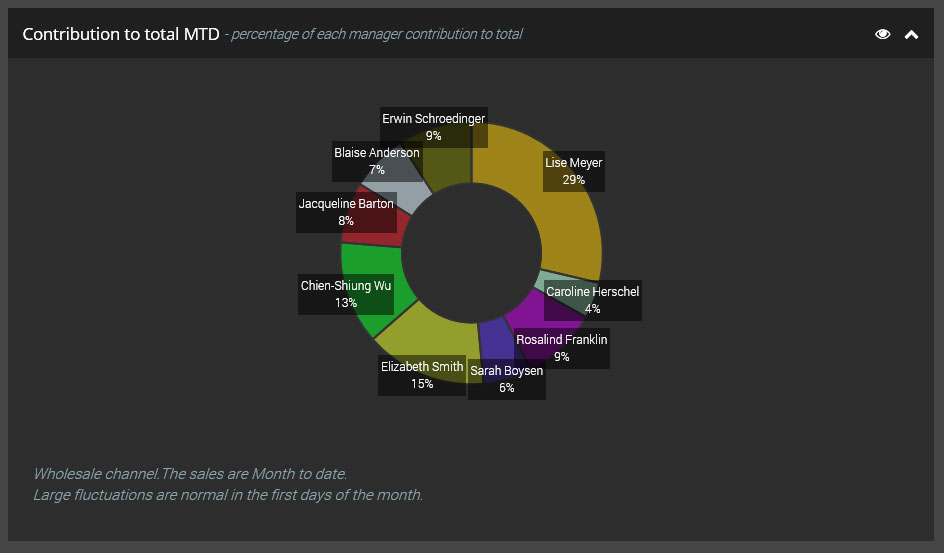
- Individual contribution to company growth: This model was developed after months of observing internal competition. Its introduction, even as just a data visualization tool, brought balance to the competition.
The Solution: All Plus One
With fairness and transparency as guiding principles, and to address internal challenges, the final dashboard design included the following elements:- Percentage of target
- Individual revenue per day comparison graph
- Growth in net and percentage (sortable table)
- Individual contribution to company growth